ClickCease
← All Services

Laundromat marketing reports that count customers, not clicks

Your portal reads every card, visit and reload from your Laundroworks POS. You see how many new customers came in, who we brought back and what they spent, updated every day. Then your account manager goes through it with you every month.

Included with every plan · POS numbers on Growth and Growth Pro

Updated from your POS every morning
Analytics · New customers
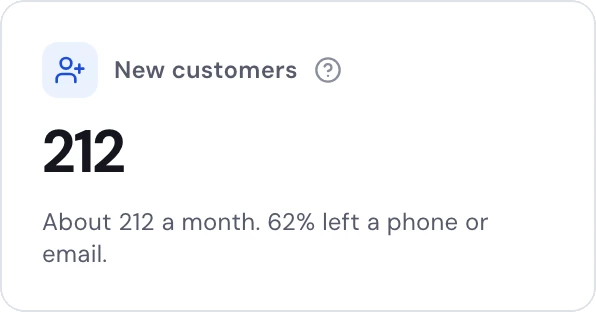
New customers: 212. About 212 a month, and 62% left a phone or email.
Analytics · Re-engagement
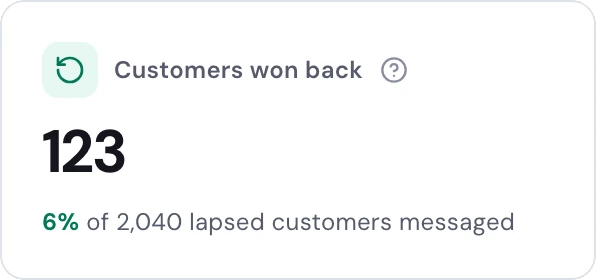
Customers won back: 123, which is 6% of the 2,040 lapsed customers messaged.
Analytics · Re-engagement
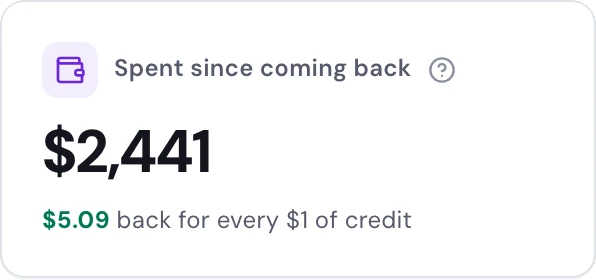
Spent since coming back: $2,441, or $5.09 back for every $1 of free credit.
Analytics · Laundroworks
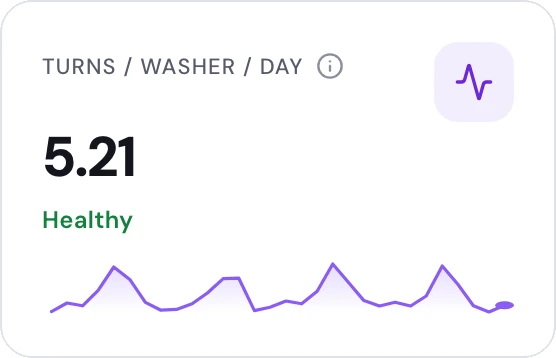
Turns per washer per day: 5.21, rated healthy, with a sparkline of the month.

Client portal · demo store

What we track for you

Six numbers that tell you if it’s working

Clicks and impressions don’t pay the rent. These come from the visit records in your POS, so every one of them is a real person at your machines. Here is September for our demo store, as its portal shows it.

New customers tab

New customers

212

came in for the first time in September, 25 more than in August.

How we count it

A person’s first visit ever, on any of their cards. A regular with a replacement card is not new.

New customers tab

Came back within 30 days

41%

of August’s 187 new customers came in again within a month.

How we count it

A month’s group is shown only once every one of them has had the full 30 days.

New customers tab

Paid in, first 90 days

$57.50

from each new customer on average, over 4.6 visits.

How we count it

Cash and card loads from their own pocket. Free credit from an offer is taken out.

New customers tab

Ad spend for each new customer

$11.60

$2,460 of ads, spread across all 212 new customers.

How we count it

Some of them found you another way, so this is the least a customer from your ads could have cost.

Re-engagement tab

Customers won back

123

of the 2,040 lapsed customers we texted or emailed.

How we count it

They had not been in for over a month, got a message from us while they were away, and came back within 30 days of it.

Re-engagement tab

Spent since coming back

$2,441

Their cards paid $2,921 at your machines: $480 of it was our free credit, $2,441 their own money.

How we count it

Read from the visit records in your POS, not estimated. Only their own money is counted here.

Month-end report

Customer retention

63.4%

of August’s customers came back in September, out of 3,184 active customers. It has gone up every month since April.

Demo store figures. The New customers and Re-engagement tabs come with Growth and Growth Pro, and need a connected Laundroworks POS.

New customers

Every first-time customer, followed for 90 days

The New customers tab follows each new person from their first visit: whether they came back, how often, and what they paid in over their first 90 days. Then it puts that next to what your ads cost.

The New customers tab in the client portal for the demo store's September: 212 new customers, 41% of those 30 days in came back within 30 days, 4.6 visits and $58 paid in over the first 90 days, and a table and curve of their first 30, 60 and 90 days ending at $57.50 paid in by day 90.
Client portal · Analytics · New customers · demo store
New customers against your ad spend: $2,460 of ads, 212 new customers, $11.60 of ad spend for each, and $58 paid in by a new customer in their first 90 days. Below it, what the 58 customers who used the ad offer code did after the free credit: 41 spent their own money, and their cards paid $1,195, of which $290 was free credit and $905 their own money.
New customers · against your ad spend
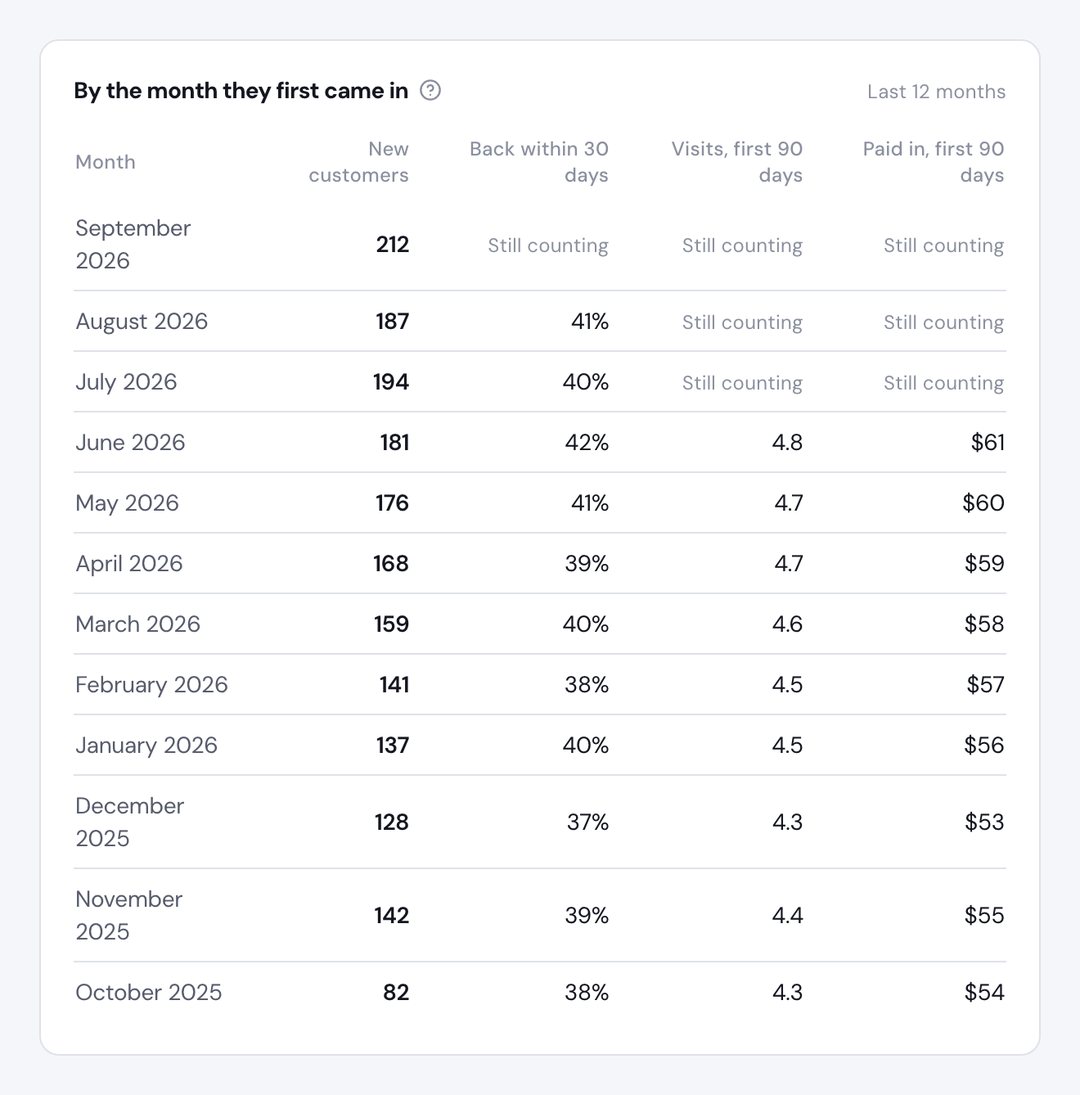
New customers by the month they first came in, from October 2025 to September 2026, when 212 came in, the most of any month, with the share back within 30 days, visits and money paid in over the first 90 days, and Still counting for the months not yet 90 days in.
Swipe sideways to see the rest →
New customers · month by month
  • ✓Real people, not cards. A regular who gets a new card is not counted again.
  • ✓Month by month and store by store, so you see where growth comes from.
  • ✓Next to your ad spend, so you know what a new customer costs and what one is worth.

Bringing customers back

See who came back, and what they spent

When a customer stops coming in, we text or email them. The Re-engagement tab shows who came back, how fast, which message did it, and every dollar they have spent since, read straight from your POS.

The Re-engagement tab for the demo store's September: 123 customers won back, 6% of 2,040 lapsed customers messaged; 96 promo codes used; $480 of free credit given and $92.40 of messages; $2,441 spent since coming back. Below, the path from 2,040 messaged to 123 back within 30 days, 96 who used a code and 64 back a second time, and what they did after coming back: 97 spent their own money, and their cards paid $2,921, of which $480 was free credit and $2,441 their own money.
Client portal · Analytics · Re-engagement · demo store
The won-back customers list, newest first, with each customer shown by initials: the day they came back, the message that brought them back, the code they used, what they paid that day and since, their visits, and whether they are coming regularly or came once.
Swipe sideways to see the rest →
Re-engagement · every won-back customer, by name in your portal
Which message brought them back: the $5 off text brought back 71 who have spent $1,409, the win-back email 30 who have spent $595, and the comforter season text 22 who have spent $437. Below, how fast they came back: 9 the same day, 31 in 1 to 3 days, 34 in 4 to 7 days, 29 in 8 to 14 days and 20 in 15 to 30 days.
Re-engagement · which message, how fast
How we count a win-back

They had really stopped

No visit for over a month, then a text or email from us while they were away, then back in within 30 days of it.

One person, not one card

Cards are matched by phone or email, so a customer with two cards is counted once.

Their money, not our credit

Spend is what they paid in from the day they came back. Free credit from an offer is shown on its own line.

Your POS data

Everything your Laundroworks system records, in plain English

Your POS logs every card, every visit, every reload and every machine start. Most owners only ever look at the daily total. We pull all of it into your portal, as far back as Laundroworks keeps it, and add to it every day.

9,860
Cards
Each with its balance, home store and last visit
361,200
Store visits
One for every card, store and day it was used
158,600
Card reloads
Every dollar loaded at your kiosks
629,800
Machine starts
With the machine and what the cycle cost

What the demo store’s portal holds after three years on Laundroworks.

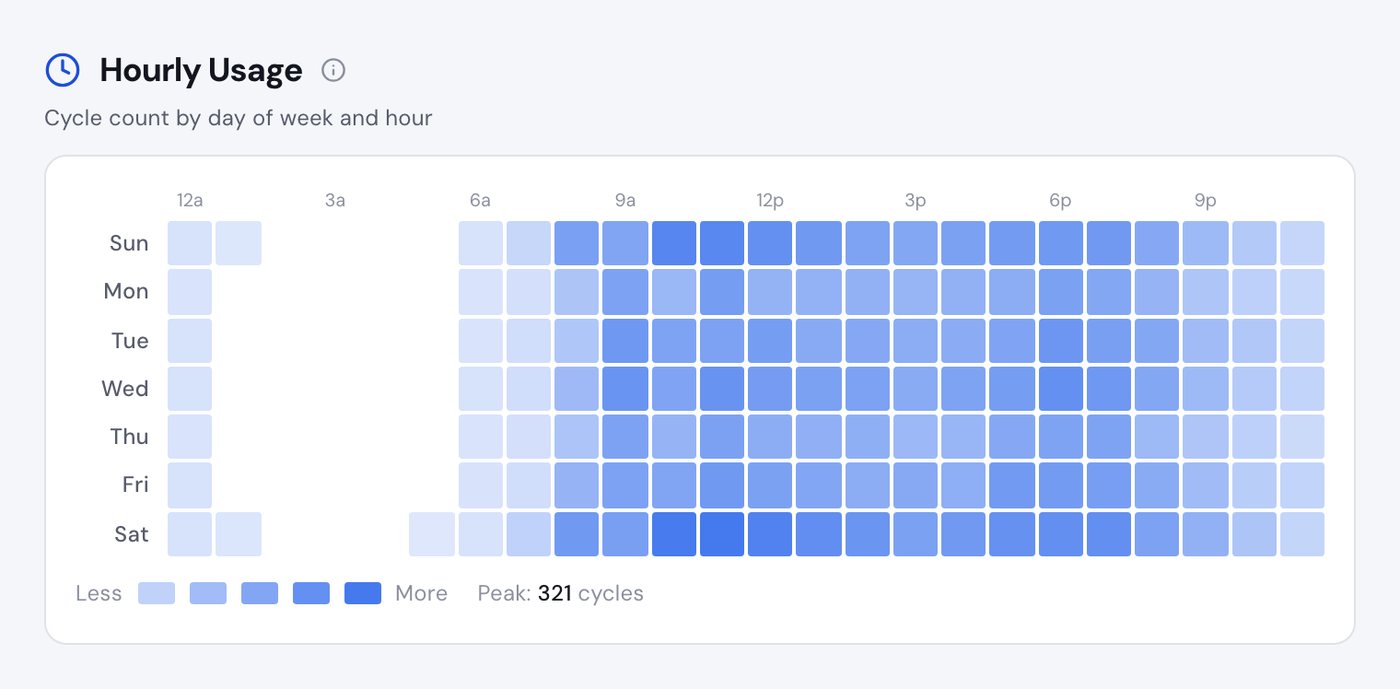
The Laundroworks tab, Washers, Dryers and Equipment, for the demo store's four locations in September: 20,754 cycles, $3.52 a cycle, 5.21 turns per washer per day rated healthy, $19.20 per machine per day, 127 active machines, busiest at 11 AM, and an hour-by-day heatmap of cycles, busiest on Saturday late morning.
Client portal · Analytics · Laundroworks · demo store
Hourly usage: a heatmap of cycles started by day of the week and hour of the day, busiest on Saturday late morning.
Swipe sideways to see the rest →
Laundroworks · hourly usage
Reliability: 41 errored starts out of 20,795, a 0.2% error rate, with the worst machines listed: a dryer at Brandon with 14 errors and a washer at Riverview with 9. Below, the errors day by day across September.
Laundroworks · machines that need a look

Customer & Revenue

Revenue by day and by weekday, new and active customers, card reloads, what a customer is worth, and loyalty dollars still on cards.

Washers, Dryers & Equipment

Turns per washer per day, your busiest hours, revenue by machine and by size, and the machines throwing errors.

Payments & Cards

How people pay: cash against card over time, the full payment mix, and what surcharges bring in.

VAC & Vending

Every kiosk’s transactions, and how often cards are declined at each one.

Locations

2 or more stores

Your stores side by side on the same numbers, so you can see which one needs help.

Store Operations

Its own page

Devices that are down, cash on hand, what needs collecting, and a leaderboard of your machines.

On Growth and Growth Pro, once your Laundroworks account is connected.

Every Monday

Your store’s week, in one email

A short report lands in your inbox every Monday with last week’s numbers from your own POS. Plain facts about your store, no sales pitch, and nothing you have to log in for. We switch it on for you once your POS is connected.

With a connected POS
  • ✓Revenue and cycles against the week before, day by day
  • ✓Turns per day, and how full your washers got at your busiest hour
  • ✓New customers, your regulars, and how many first-timers came back
  • ✓Regulars who have stopped coming, and any machine that ran no cycles all week
  • ✓Every store side by side, if you have more than one
Sunshine Wash & Fold: $17,433 last week
Your weekly operations report from Fresh Leads Marketing
The weekly operations email for the demo store, the week of September 21 to 27: $17,433 of revenue over 4,934 cycles, a bar for each day with Saturday the best at $3,388, a summary of what changed, 5.3 turns per washer per day, 49 new customers, a 63.4% retention rate, 812 regulars, a 41% first visit return rate, $184.20 average customer value, 68% of washers in use at the busiest hour, revenue, turns and new customers for each of the four stores, and two things that need attention: 14 regulars who have not been in for 30 days or more, and one machine at Riverview that ran no cycles all week.
Weekly operations email · demo store

The rhythm

You hear from us before you have to ask

Every day

Live in your portal

Ad spend, leads, customers and store numbers, updated daily. You never wait on a report to know how the week went.

Every Monday

Weekly operations email

With a connected POS

Your own POS numbers: revenue week over week, new and repeat customers, turns per day, store by store.

Every month

Report and strategy call

A written report on everything we run for you, then a call with your account manager to go through it and plan the month ahead.

Every quarter

The deep dive

A longer look at the whole business: advertising, email and text, conversations, revenue year over year and reviews.

The month-end report

Everything we ran, and what it brought in

One email covering the whole calendar month against the one before. You only see sections for the services you have. It’s written up and sent by your account manager, so when you reply, a person answers. The one shown here is the real email, filled in for the demo store.

✓Your ads
Spend, customer actions and cost per action on Google, plus reach and clicks on Facebook and Instagram.
✓New customers
How many came in for the first time, and what a new customer goes on to spend.
✓AI chatbot & voice agent
Conversations handled, when they came in, and what people asked about.
✓Bringing customers back
Who came back after a text or email, their visits, and what they have spent since.
✓Customer retention
The share of last month’s customers who returned, with a six-month trend.
✓Google reviews
New reviews, your rating, and what people loved or flagged.
✓Local search
Where you rank in Google Maps, and whether AI search names you.
✓Commercial accounts
Businesses contacted, quotes sent and accounts won.
✓Next steps & waiting on you
What we recommend for next month, and anything we need from you.
Sunshine Wash & Fold · Your marketing report for September 2026
From your account manager at Fresh Leads Marketing
A month-end marketing report email for the demo store. It opens with a note from the account manager, then covers ad spend and results on Google, Facebook and Instagram; new customers; AI chatbot and voice agent conversations; past customers brought back, with their visits and what they have spent since; customer retention; Google reviews; local search rankings; commercial accounts; recommended next steps; and what is waiting on the owner, ending with a button to book a call.
Month-end report email · demo store

The strategy call

A monthly call about what happens next

Your account manager brings the month on slides, so you’re both looking at the same thing. You leave knowing what worked, what we’re changing, and what we need from you. These are real slides from the deck, filled in for the same demo store.

The month · The month in three numbers

September in three numbers

What we did for your store this month, and what came of it.
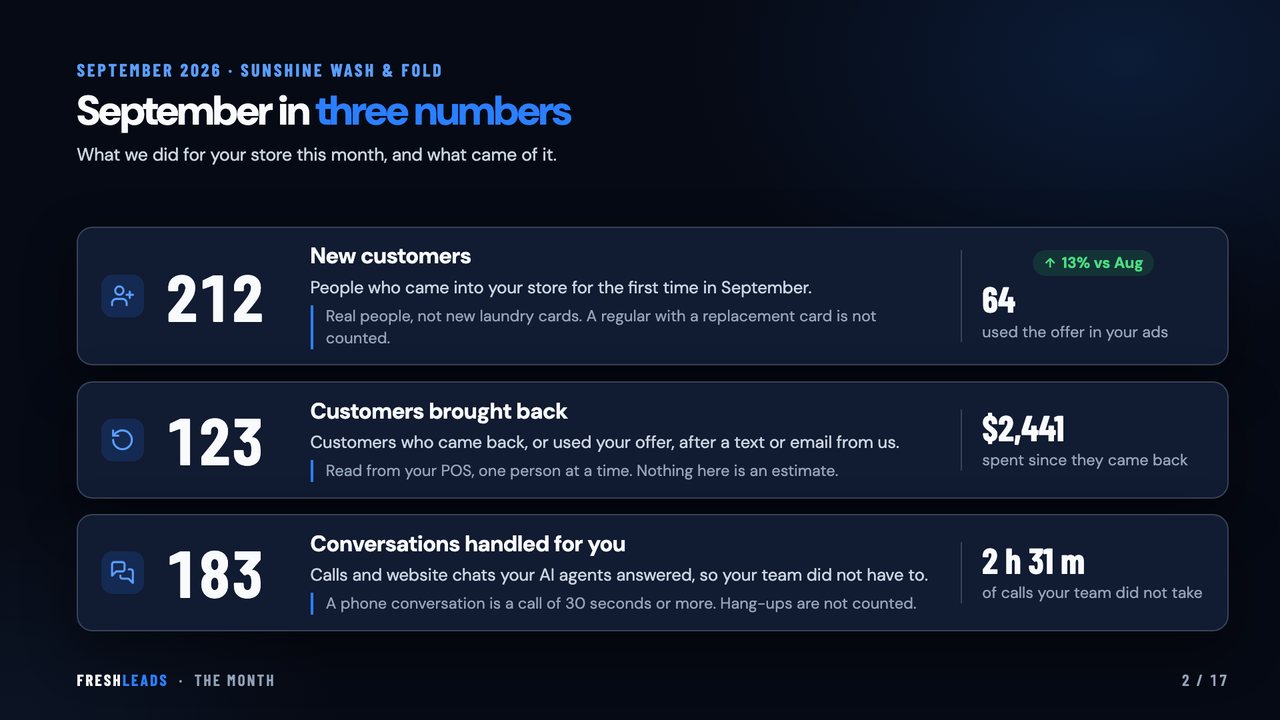
Review deck slide 1 of 6. September in three numbers: 212 new customers, 123 customers brought back who have spent $2,441 since, and 183 conversations handled.

On a phone, turn it sideways for a closer look at each slide.

Month-end review deck · demo store

  • ✓One person who knows your store and your market
  • ✓A Book a Call button on every page of your portal
  • ✓Messages to your team, right in the portal
  • ✓A running log of the changes we make to your account

"My last agency sent a PDF I couldn't read."

Most reports are built to look busy: impressions, click-through rates, a wall of charts, and no sentence telling you whether any of it worked.

Ours answers three questions. What did you spend, what did it bring in, and what are we doing about it next month. Then a person gets on a call and goes through it with you.

Common questions

Your questions, answered

Who is my account manager?
−

A named person on our team who works only with laundromats. Their name is on every report, and their calendar is behind the Book a Call button in your portal.

How often will we talk?
+
Do I have to wait for the report to see results?
+
Is the report automated?
+
How do you know a customer came back because of a message?
+
Are those real numbers on this page?
+
Which plan includes it?
+

From the blog

More on knowing your numbers

All articles →

Ready to grow?

Always know what you're paying for

Book a free call. We'll audit your market and build a custom plan. No commitment required.

Free Marketing Audit →

No commitment. Just a clear plan.